VS Code & Cursor Extension
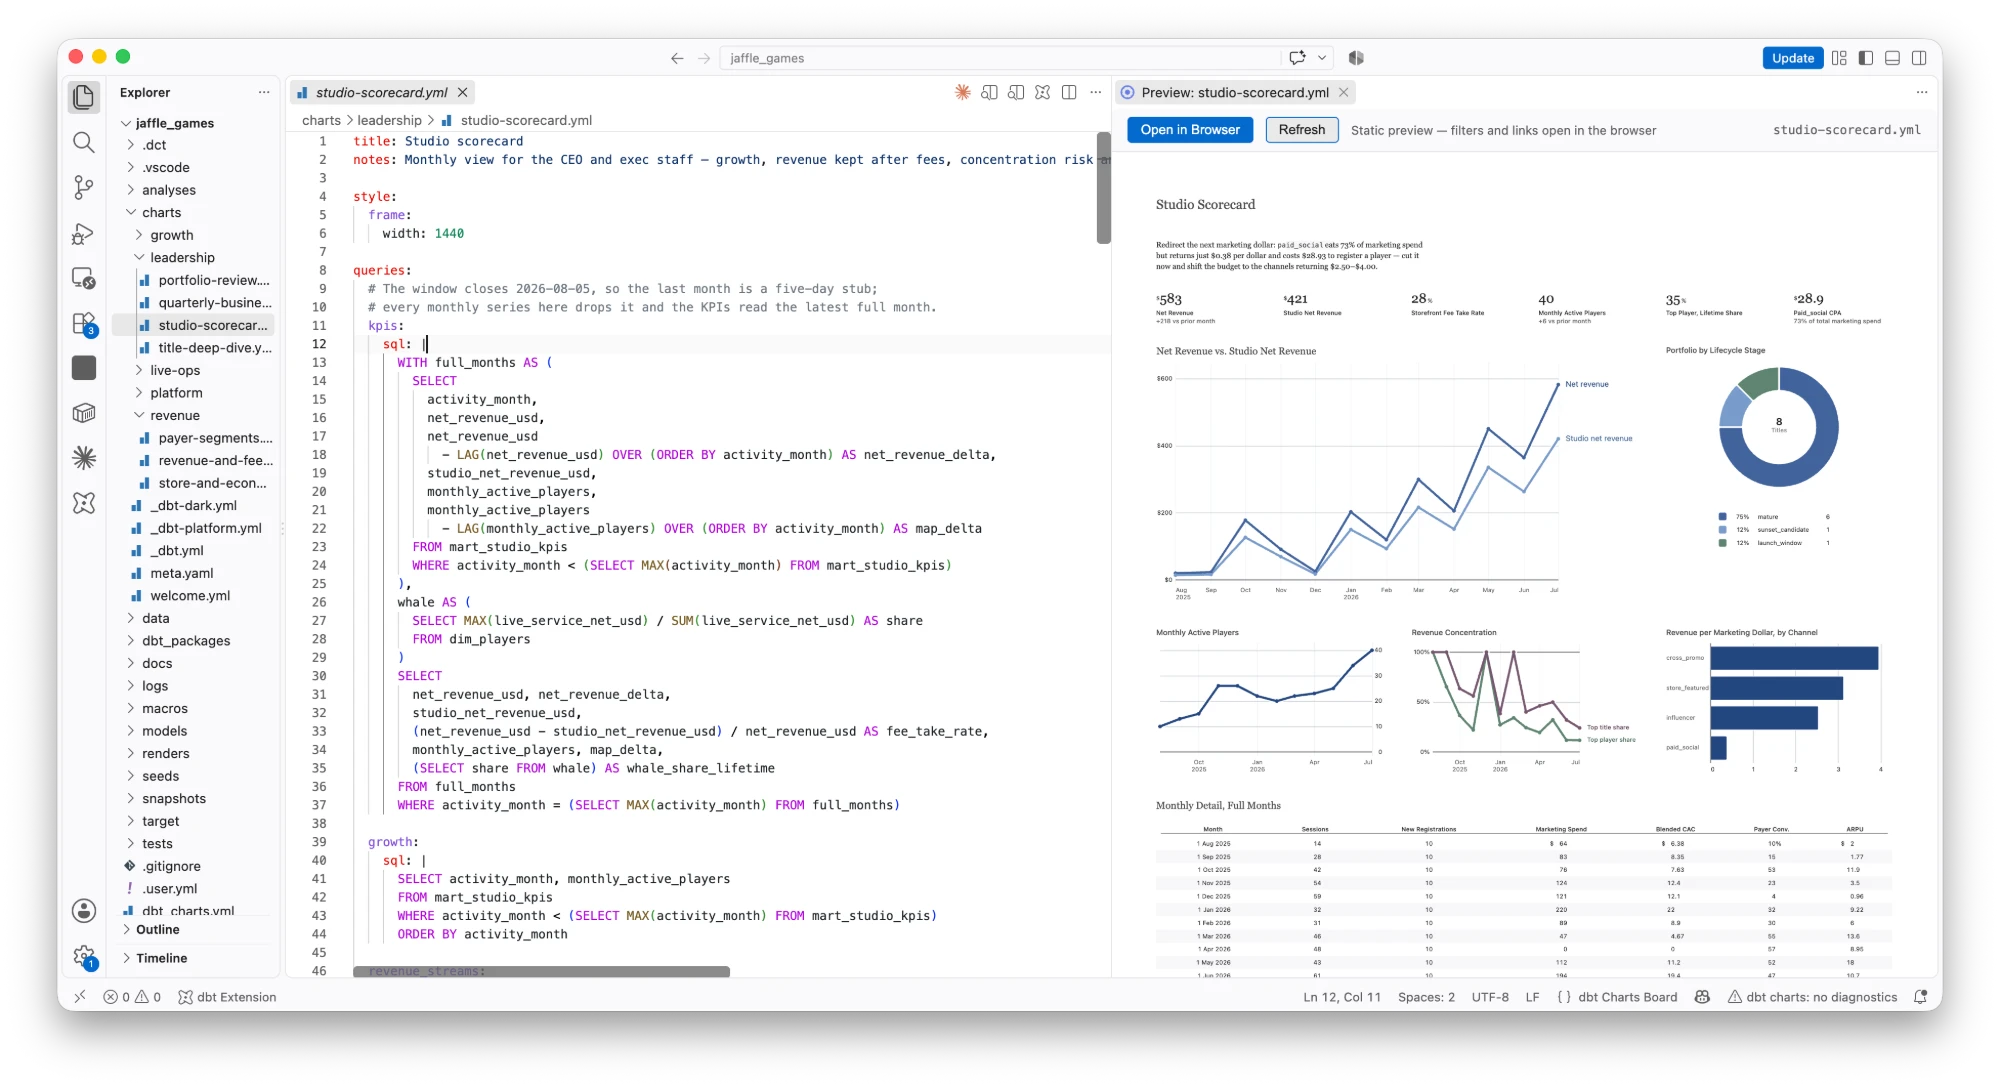
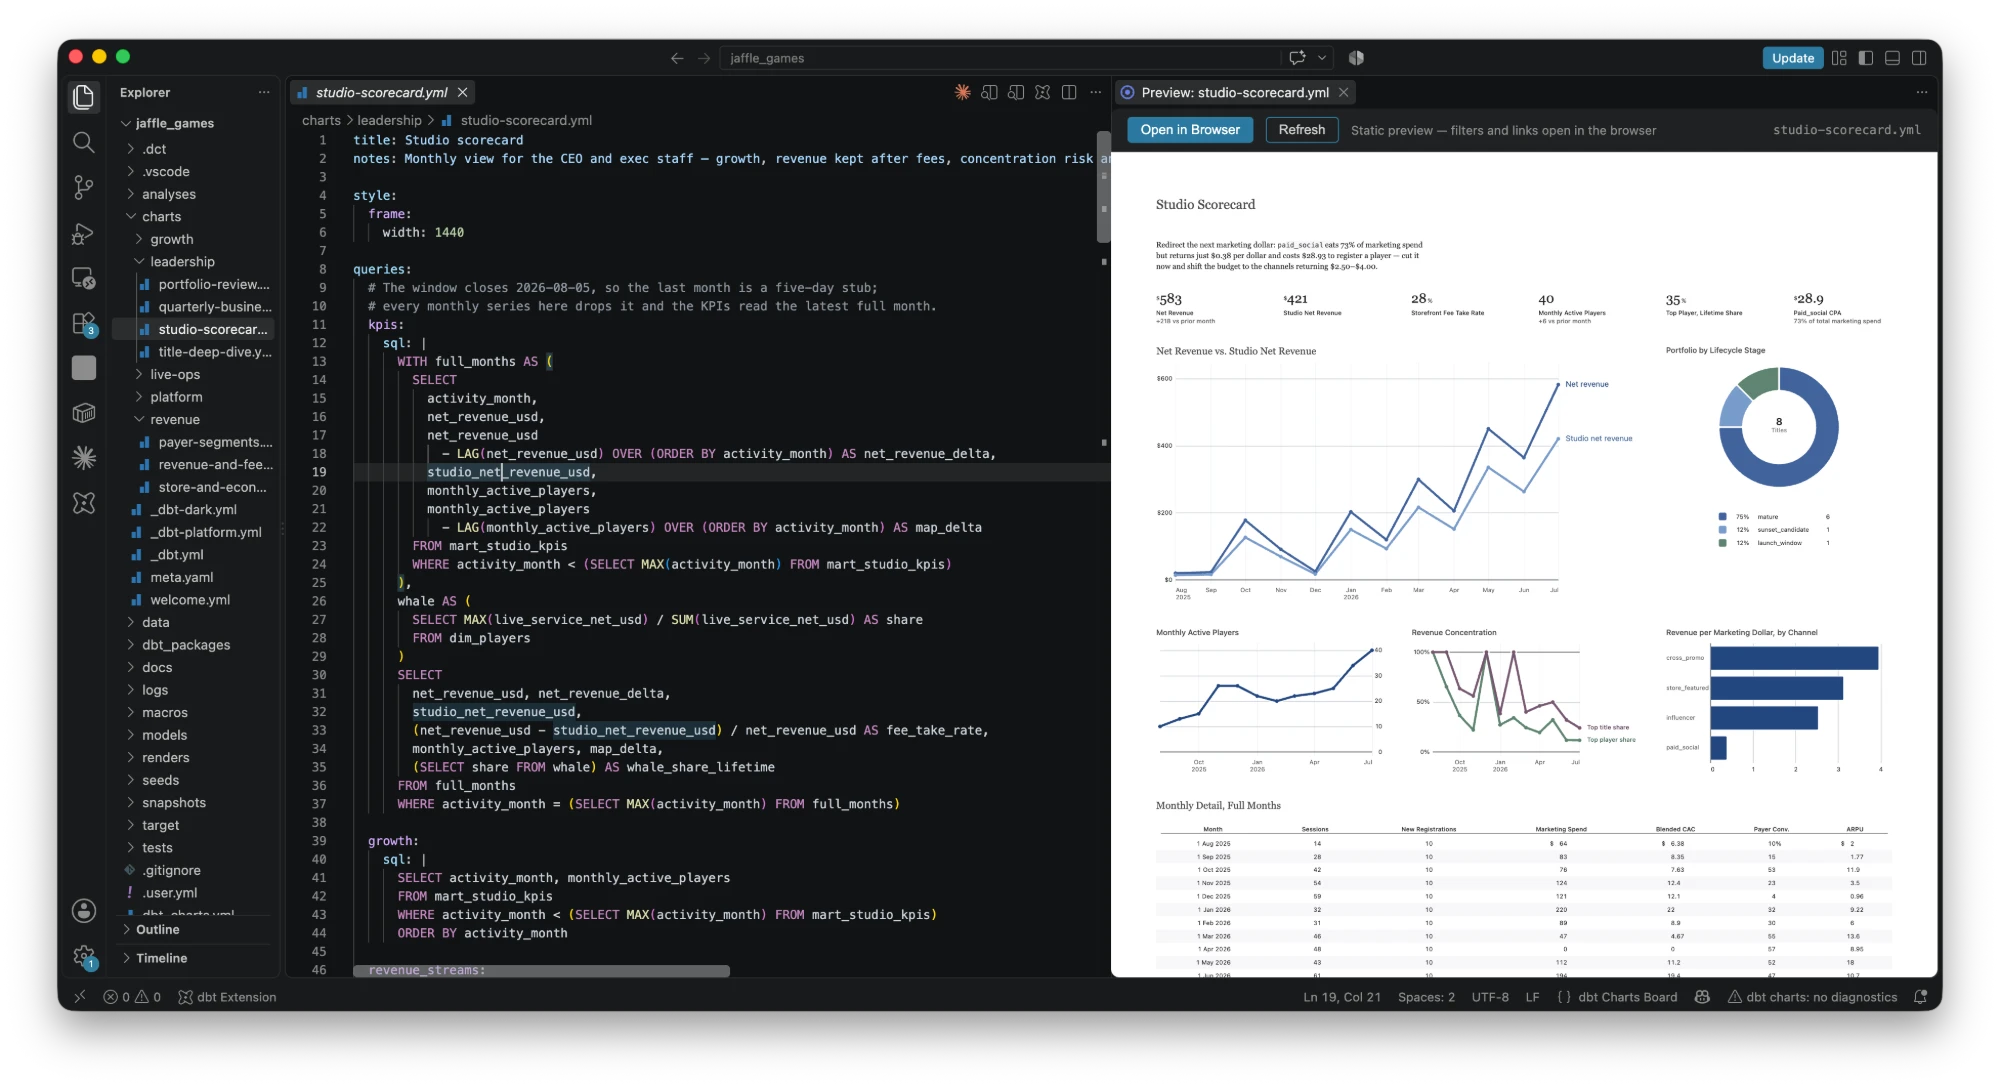
The dbt Charts extension turns any editor built on VS Code (VS Code itself, Cursor, and other forks) into a dashboard authoring environment: syntax highlighting for board YAML (including the SQL and Jinja inside it), snippets for every chart and layout type, and a live split-pane preview of the rendered dashboard next to the file you are editing.
Install
VS Code: Install from the VS Code Marketplace, or open it directly in VS Code.
Cursor and other VS Code forks: install from Open VSX, the registry they resolve extensions from.
Or search for dbt Charts in the editor's Extensions panel. The
extension ID is dbtLabsInc.dbtcharts in every editor, so it also installs
from a terminal:
The editor keeps the extension updated, the same as any other marketplace install. To pin a specific version instead, VS Code accepts a version suffix (Cursor does not document a CLI version-pin flag):
The dct init setup wizard also offers to install the
extension for any editor it finds on your PATH, and dct init code or
dct init cursor does it directly.
Requirements
- VS Code 1.91 or later (or a fork of an equivalent version, such as Cursor)
- The
dctCLI for preview, export, and validation; highlighting, snippets, and completion work without it
Which files it recognizes
The extension switches a file into dbt Charts mode (highlighting, snippets, and completion) when any of these hold:
| Rule | Examples |
|---|---|
File is named dbt_charts.yml |
your project config |
Filename ends in .board.yml |
sales.board.yml |
Any .yml, .yaml, or .md file under a charts/ directory inside a project (a folder with a dbt_charts.yml or dbt_project.yml ancestor) |
charts/sales.yml, charts/partials/_header.yml |
Any other .yml / .yaml file whose content has a queries: or charts: block and a rows:, cols:, grid:, or tabs: layout |
a dashboard file kept outside charts/ |
The charts/ rule matches on an exact path segment inside a recognized project
root, so a directory named my_charts_backup/ (or a charts/ folder in a repo
with no project marker) is left alone. The content rule is a fallback for files
kept outside charts/; it applies once the extension is active in the
workspace, which any of the other rules (or opening the preview) takes
care of.
Live preview
Press Cmd+Shift+V (macOS) or Ctrl+Shift+V (Windows/Linux) to open the rendered dashboard beside your file, or run dbt Charts: Open Preview to the Side from the Command Palette. The preview:
- Re-renders as you type, debounced, and again on every save
- Renders real data. It shells out to
dct renderin your project, so queries hit the same sources your dashboards use in production - Is a static render, and says so. The preview shows
dct renderoutput, an artifact. Its variable pills are a picture of the controls, not the controls, and its board links point at a server the panel does not have. Clicking either one opens the board in your browser behinddct serve, where they are live - Navigates back to source. Click a chart in the preview to jump to its definition in the YAML
Preview requires the dct CLI. The extension looks for it in a venv/,
.venv/, or env/ beside your workspace, then in uv's tool directory and
~/.local/bin, then on your login shell's PATH (an editor launched from the
macOS Dock doesn't inherit it); point dbt-charts.cli.path at it
directly if it lives elsewhere. When a render fails,
the preview pane shows the same structured error you would get from
dct validate, so you can fix the YAML without leaving the
editor.
Syntax highlighting
Board YAML is highlighted as a language in its own right, not as generic YAML:
- YAML structure, with dbt Charts's own keywords (chart types, input types, and top-level keys) called out distinctly
- SQL inside
sql:blocks, highlighted as SQL - Jinja templating (
{{ ... }},{% ... %}) inside those SQL blocks
The highlighting rules are generated from the same schema the engine compiles against, so new chart types and keys light up as soon as you upgrade.
Completion
Value completion for the fields whose options are a fixed set (theme:, chart
type:, and variable input:) works out of the box, with no Python and no
other extensions installed. The values come from the schema shipped inside the
extension, so you get the real list rather than whatever words happen to be
elsewhere in the buffer.
Completion for keys, query references, and chart references is part of the optional language server.
Snippets
Type a prefix and press Tab to expand a working scaffold.
| Prefix | Expands to |
|---|---|
dbt-charts:board |
Complete board skeleton |
query |
SQL query definition |
query-filter |
Query with a Jinja filter() call |
query-dbt |
Query using dbt ref() |
chart |
Generic chart definition |
chart:kpi |
KPI / metric card |
chart:table |
Data table |
chart:map |
Geographic map |
variable:select |
Select dropdown variable |
variable:select-query |
Select variable with options from a query |
variable:daterange |
Date range picker variable |
variable:slider |
Number slider variable |
layout:rows |
Vertical row layout |
layout:cols |
Horizontal column layout |
layout:grid |
Grid layout |
layout:tabs |
Tabbed layout |
source:duckdb |
DuckDB source block |
source:postgres |
PostgreSQL source block |
jinja:filter |
Jinja filter() call for a WHERE clause |
jinja:ref |
dbt ref() call |
jinja:if |
Jinja if block |
Most prefixes have plain-language aliases too (dashboard, query, kpi,
grid, and so on) so the snippet surfaces even if you don't remember the
exact prefix.
Export and validation
Run these from the Command Palette (Cmd/Ctrl+Shift+P) with a board file open:
- dbt Charts: Export as HTML: render to a standalone HTML file
- dbt Charts: Export as PNG: render to an image
- dbt Charts: Validate Dashboard: run a full
dct validatepass and report the result
All three call the dct CLI, so the output is identical to running
dct render yourself.
Validation in other editors
Any editor with a YAML language server (Neovim, JetBrains, Zed, vscode.dev) can complete and validate a board against its published JSON Schema. Put this line first in the file:
dct migrate keeps it first
and stamps _schema_version below it. The URL serves the latest dbt Charts
release's schema and becomes available with the first release that publishes
one. After upgrading, run dct migrate to clear any warnings about older
syntax. To pin a release, use
https://docs.dbtcharts.com/schema/<version>/board.json. The file is large and meant for validators, not for AI
agents to read: they should use dct validate instead.
AI integration
The extension pairs with the dbt Charts MCP server, which gives Cursor's and VS
Code's AI assistants tools to inspect your schema, run queries, and render
dashboards. Run dbt Charts: Setup AI Integration (MCP) from the Command
Palette and it wires up the workspace for the editor you're in, writing
.cursor/mcp.json in Cursor or .vscode/mcp.json in VS Code. In Cursor, the
extension offers this once per workspace when no dbt Charts entry is configured
yet.
The equivalent from a terminal:
dct init mcp           # auto-detect installed AI clients
dct init mcp cursor    # or target one
dct init mcp vscode
See dct mcp for the server and the tools it exposes.
Optional language server
A Python language server ships inside the extension and adds deeper editing features, checked against the real compiler rather than a static schema:
- Diagnostics as you type: every error and warning the compiler produces
(invalid chart and input types, undefined query references, missing required
fields), each with a clickable code that opens its documentation page.
Warnings about redundant authored elements (unused charts, redundant labels)
appear faded via VS Code's
Unnecessarytag rather than as a squiggle. - Diagnostics on preview render: the 15 render-time warnings (narrow bar bands, dominant pie segments, zero-row queries, and others that require query results to evaluate) appear in a dedicated dbt-charts-render group in the Problems panel each time you trigger a preview. They are cleared automatically when you edit the file, so stale warnings never overlap with live compiler output.
- Completion for top-level keys, query references, and chart references
- Hover documentation for chart types, input types, and Jinja functions
- Go to Definition: Ctrl/Cmd+Click a query or chart reference to jump to where it's defined
- Document outline for the variables, queries, and charts sections
It is on by default and starts the first time you open a board file, so a workspace with no board YAML never launches it; the interpreter discovery that makes some systems prompt for filesystem access waits until you are actually editing a dashboard.
It needs a Python interpreter with dbt Charts installed. If the server can't start, a dbt Charts: no diagnostics indicator appears in the status bar; click it for the reason. Syntax highlighting keeps working either way. Point it at a specific interpreter with:
To turn it off entirely:
The interpreter you point at needs dbt Charts installed:
The language server's own protocol dependencies ship inside the extension, so this is the only environment requirement. Everything else in this page works without it.
Commands
| Command | Default shortcut |
|---|---|
| dbt Charts: Open Preview | none |
| dbt Charts: Open Preview to the Side | Cmd/Ctrl+Shift+V |
| dbt Charts: Refresh Preview | none |
| dbt Charts: Export as HTML | none |
| dbt Charts: Export as PNG | none |
| dbt Charts: Validate Dashboard | none |
| dbt Charts: Setup AI Integration (MCP) | none |
Settings
| Setting | Default | What it does |
|---|---|---|
dbt-charts.cli.path |
dct |
Path to the dbt Charts CLI executable |
dbt-charts.preview.autoRefresh |
true |
Re-render the preview as the file changes |
dbt-charts.preview.refreshDelay |
500 |
Milliseconds to wait after a change before re-rendering |
dbt-charts.languageServer.enabled |
true |
Run the Python language server (starts when you open your first board file) |
dbt-charts.languageServer.pythonPath |
python |
Interpreter used to run the language server |
dbt-charts.trace.server |
off |
Log LSP traffic to the dbt Charts output channel |
Point dbt-charts.cli.path at your project's virtualenv (for example
.venv/bin/dct) when dbt Charts is installed per-project rather than globally.
Troubleshooting
Preview says the render command failed, or dct was not found.
The extension could not run the CLI; the error lists every command it tried and
why each failed. If dct --version works in a terminal, set dbt-charts.cli.path
to the output of which dct. Otherwise install dbt Charts into the interpreter
VS Code has selected.
A dashboard file isn't highlighted.
Its path probably doesn't match any of the rules under
Which files it recognizes. Move it under charts/,
rename it to *.board.yml, or set the language mode manually from the status
bar.
The language server won't start.
Confirm that the interpreter in dbt-charts.languageServer.pythonPath has
dbt Charts installed, then set dbt-charts.trace.server to verbose and check
the dbt Charts output channel.
The preview renders but charts are empty.
That's a data problem, not an editor problem; run
dct query against the same source to check what the query
returns.
Related
- Installation & Setup: installing the
dctCLI dct init: project setup, including the extensiondct mcp: the MCP server the AI integration command configures- Getting Started: building your first dashboard